×
模态框(Modal)标题
在这里添加一些文本
Close
Close
Submit
Cancel
Confirm
×
模态框(Modal)标题
×
Chinese
|
English
Toggle navigation
Home
Publishing Ethics
MENU
About
About Journal
Editorial Board
Open Access
Honor
Indexed In
Impact Factors
Advertisement
Contact Us
Guide for Authors
Instructions to Authors
Reference Format
Overview Requirements
Data Collection
Standardized Usage of Scientific Names
Contributor Roles Taxonomy
Download
Copyright Agreement
Template
Journal Online
Just Accepted
Current Issue
Archive
Most Read
Most Download
Most Cited
Reader Services
Subscription
E-mail Alert
Figure/Table detail
Difference of nutritional components and metabolites in basidiomata of
Auricularia cornea
cultivated with three different substrates
LUO Yanglan, CHEN Lixin, WANG Canqin, WEI Jiaojun, LAN Taojü, WU Shengjin, WEI Shiyan
Mycosystema
, 2024, 43(
5
): 230222. DOI:
10.13346/j.mycosystema.230222
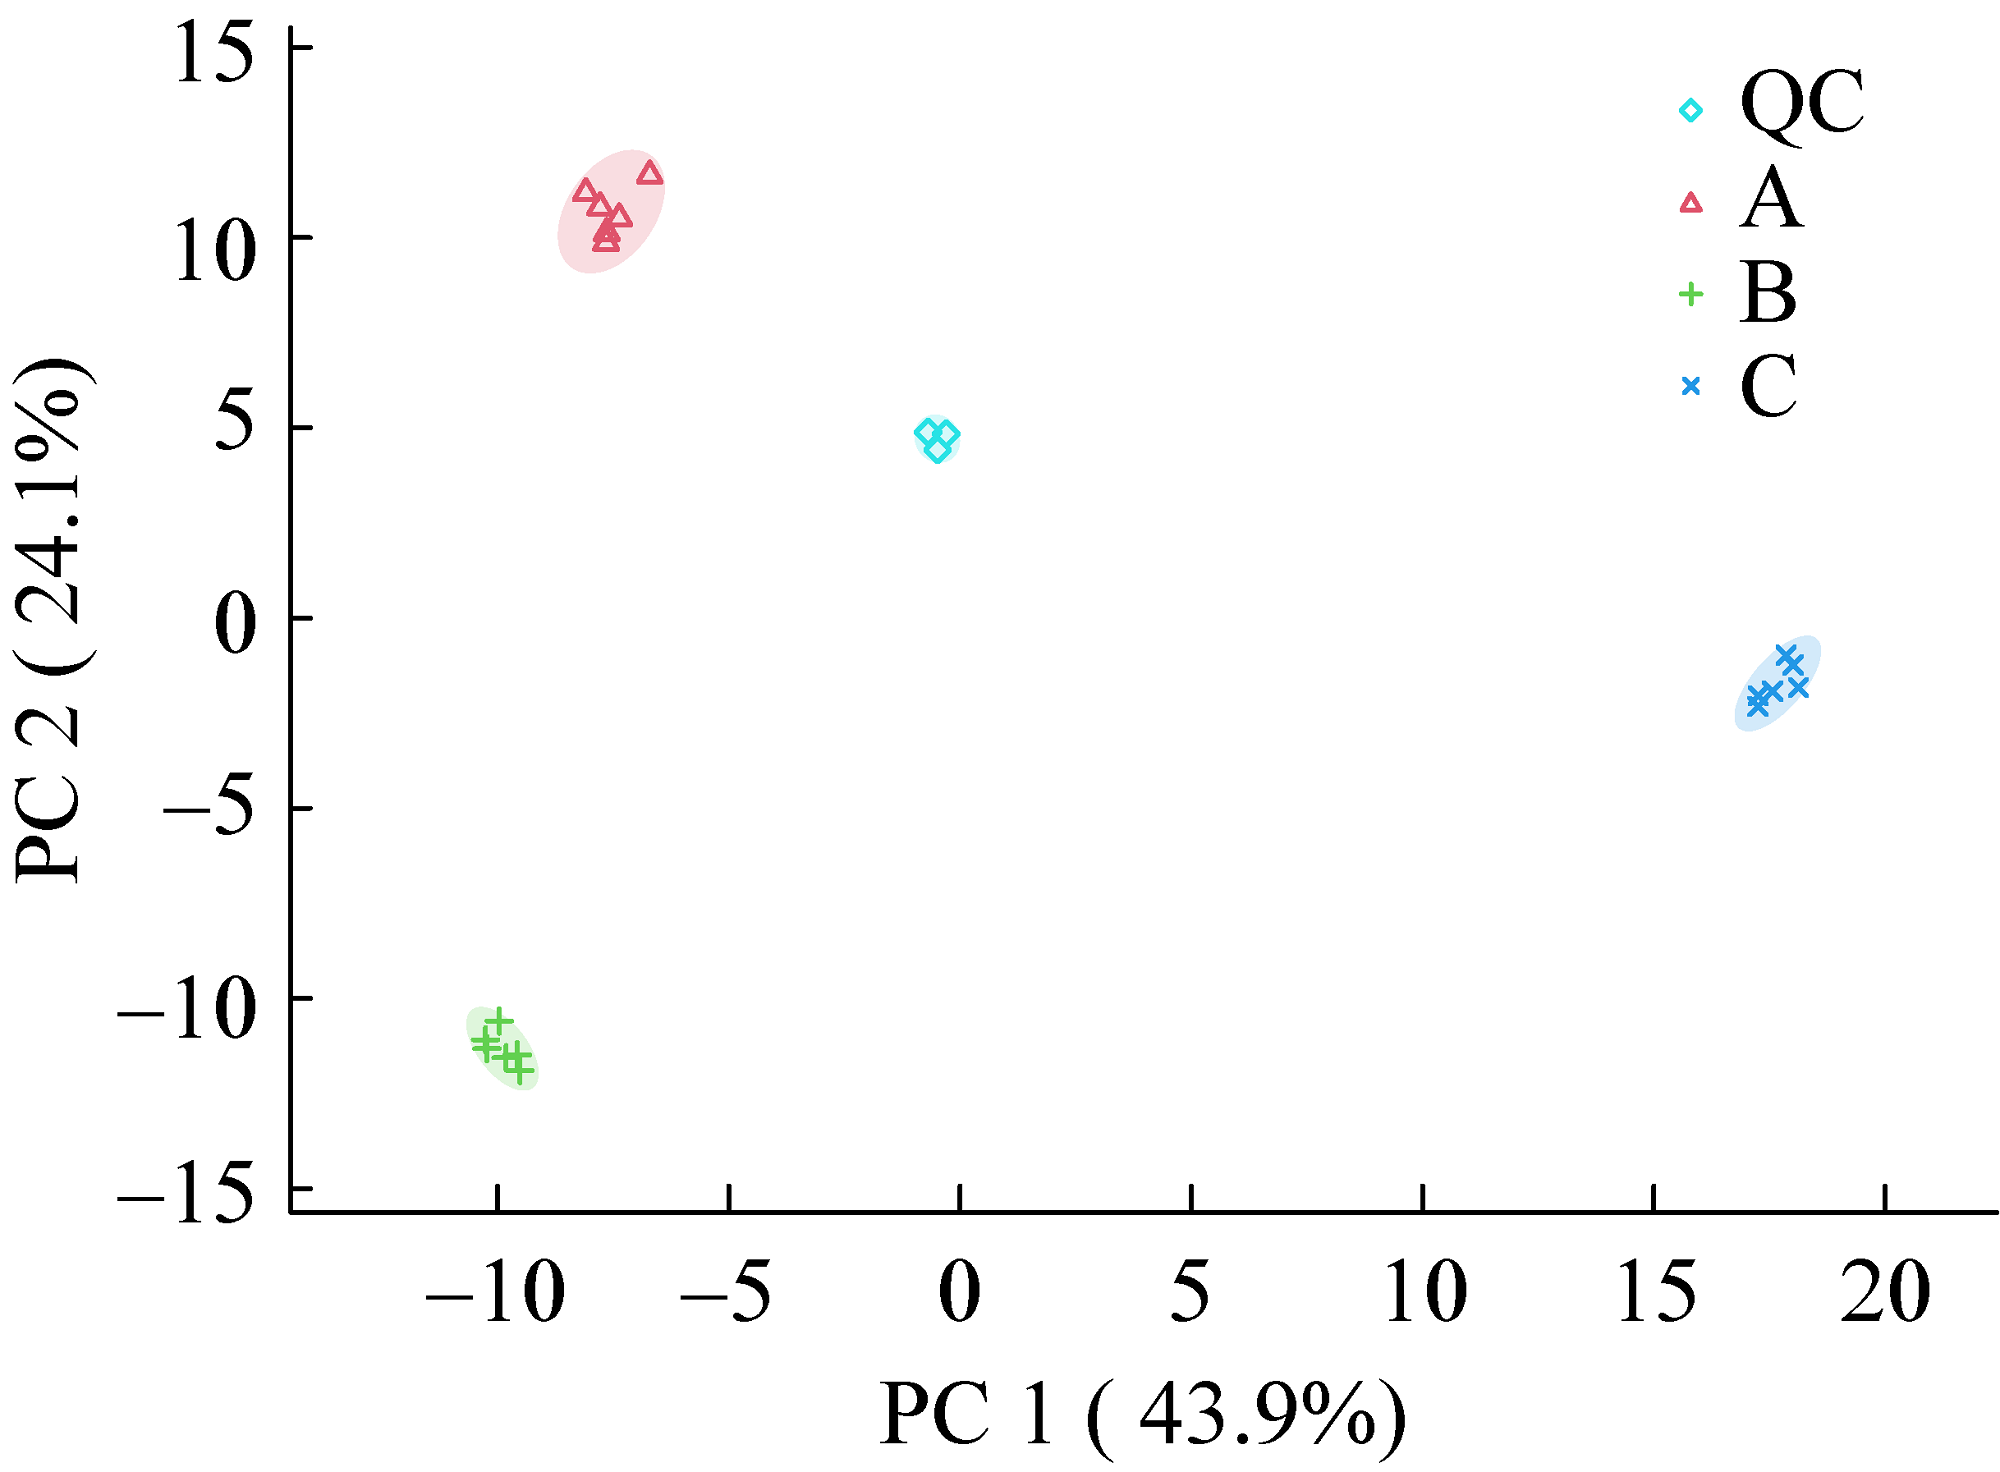
Fig. 2
PCA score plot.
A: Miscellaneous sawdust, control; B: Eucalyptus sawdust; C: Eucalyptus bark. The same below.
Other figure/table from this article
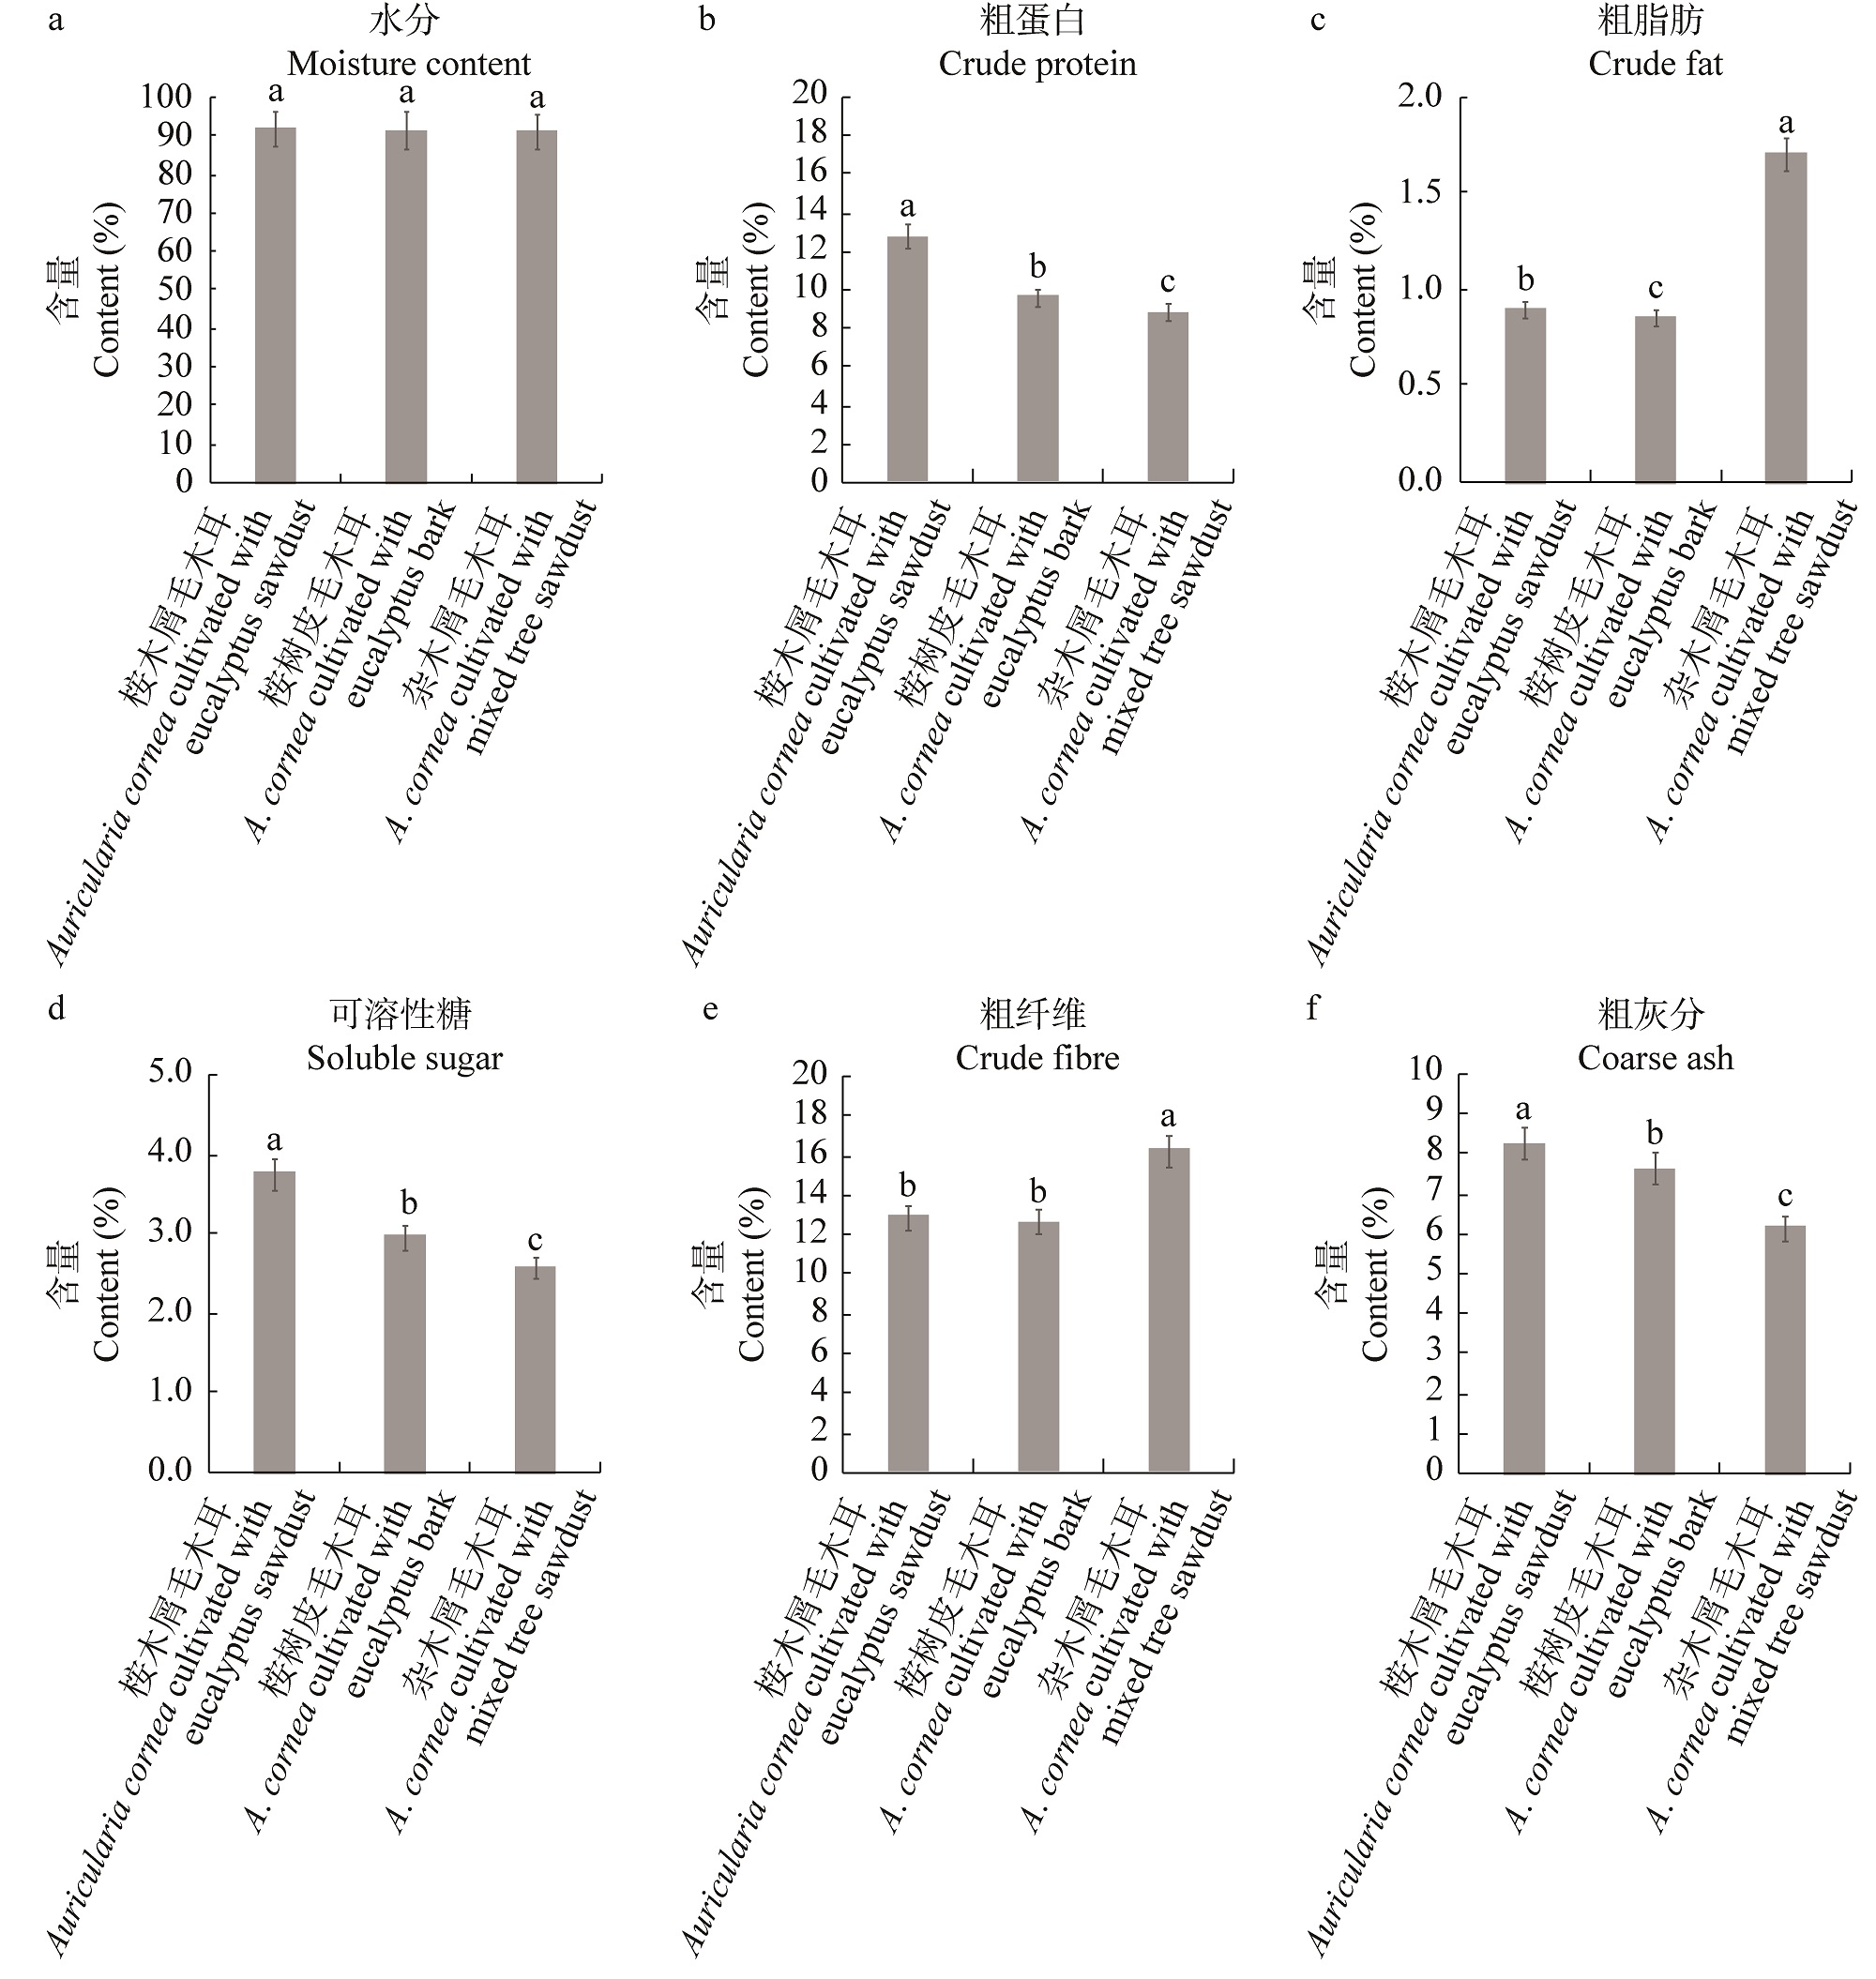
Fig. 1
The main nutritive components.
Figures a-f show the nutritive components of
Auricularia cornea
cultivated with different substrates respectively. Different lowercase letters indicate the significant difference (
P
<0.05).
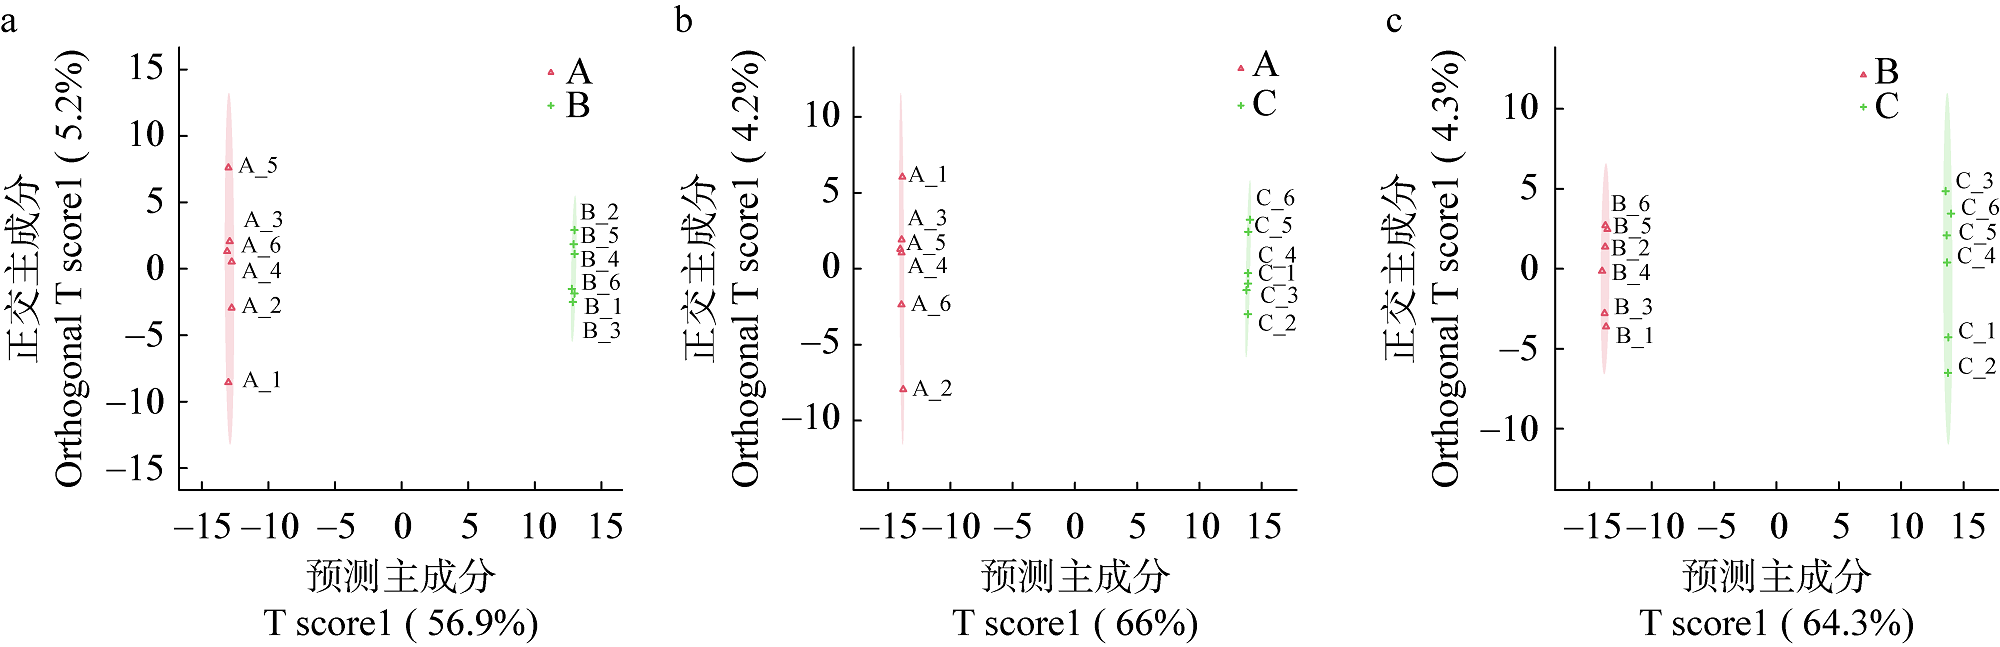
Fig. 3
OPLS-DA score plot.
Figures a, b and c show the OPLS-DA score plot of A&B, A&C and B&C respectively.
Table 1
Main evaluation indexes of OPLS-DA model
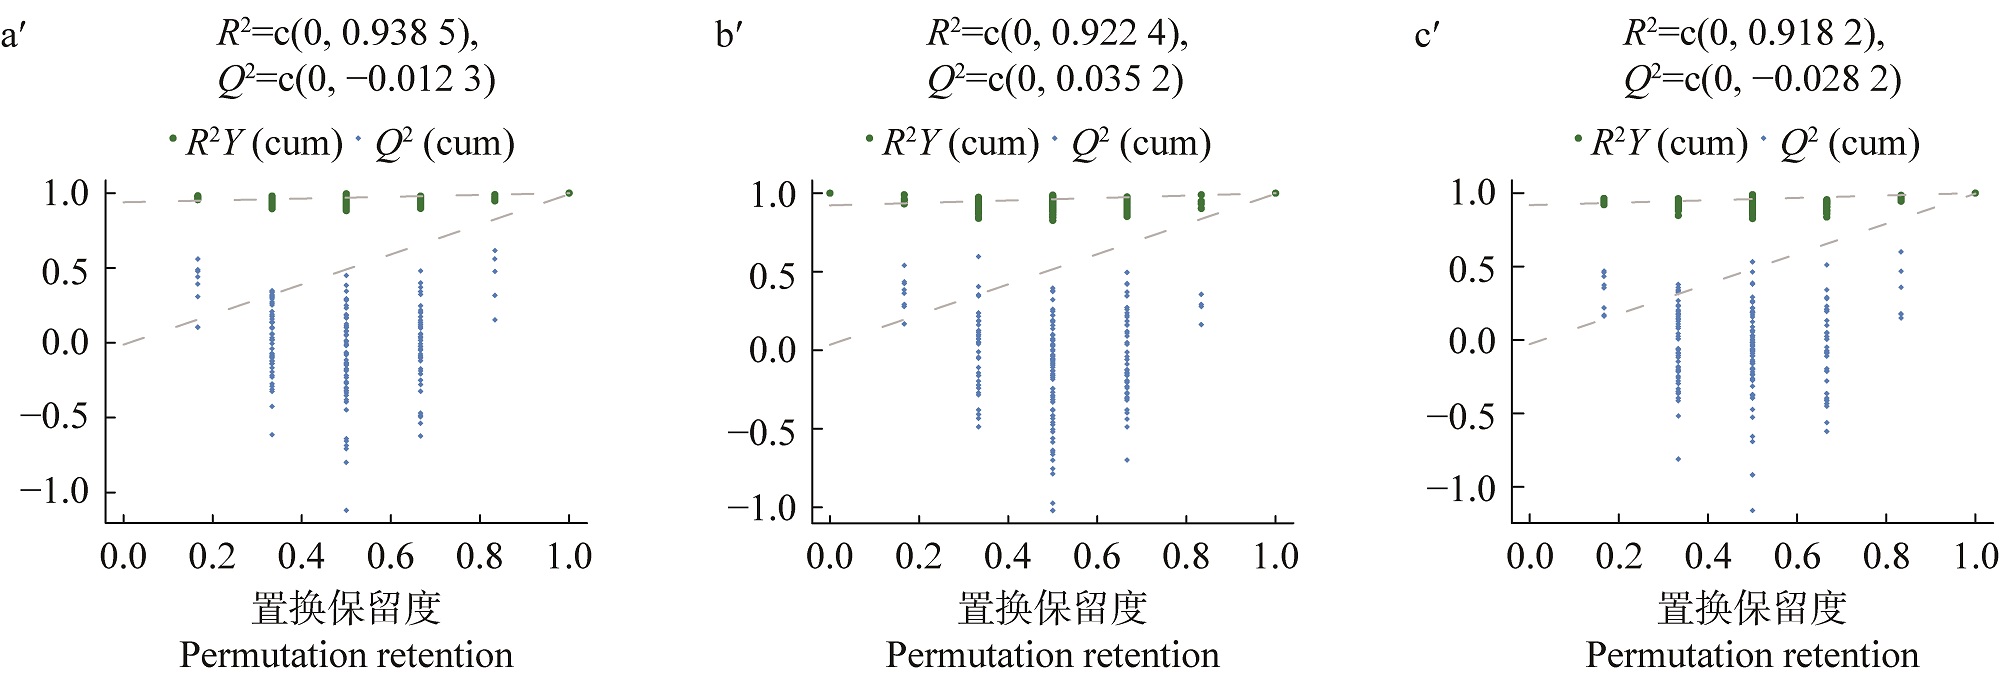
Fig. 4
OPLS-DA permutation test plots.
Figures aʹ, bʹ and cʹ correspond to comparison groups A&B, A&C and B&C respectively.
R
2
represents the cumulative variance value of the model;
Q
2
represents the cumulative cross validation of the model;
R
2
Y
(cum) represents cumulative interpretation rate.
Table 2
Different metabolites among treatment groups
Fig. 5
Hierarchical clustering heat map.
Figures a, b and c correspond to comparison groups A&B, A&C and B&C respectively. Each row represents a metabolite; Each column represents metabolites from different samples; Red indicates high metabolite content; Green indicates low metabolite content.
Table 3
KEGG pathway annotation
Fig. 6
KEGG enrichment pathway diagram.
Figures a, b and c show the KEGG enrichment pathway of A&B, A&C and B&C respectively. Each bubble represents a pathway; Abscissa represents the impact value in the pathway; Ordinate represents the enrichment significance of metabolites in the pathway -log
10
(
P
-value); Bubble size represents the impact value; The larger the bubble, the greater the importance of the pathway. Bubble color from light to deep indicates that
P
-value decreases in turn.